Introduction | Activity | Images
Analyzing Statistics
You have two charts with data on them. Looking at Chart 1 Number of Oil Rigs Drilling 1978 – 1989, you can see rows and lines of numbers. These numbers have little meaning unless they are examined carefully. The following exercises will help you find the meaning in the raw numerical data presented here.
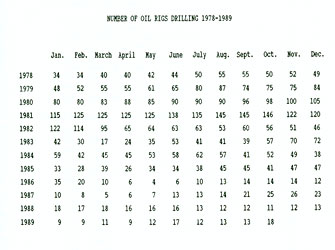 Starting with January 1978, place each number on a long graph with monthly figures ending in October 1989. One axis of your graph will have months/years. The other axis will be numbers of oil rigs in production.
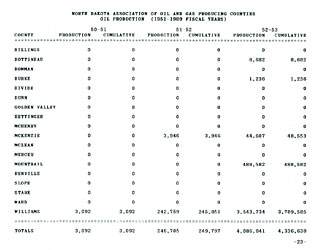 Using the three pages of Chart 2: North Dakota Association of Oil and Gas Producing counties Oil Production (1951 – 1989). There are four pages to this chart which represent the beginning, peak, and the last recorded production for this time period. Determine which county had the highest production in each year in the chart. Determine which year was the peak year.
Address:
612 East Boulevard Ave.
Bismarck, North Dakota 58505
Get Directions
Hours:
State Museum and Store: 8 a.m. - 5 p.m. M-F; Sat. & Sun. 10 a.m. - 5 p.m.
We are closed New Year's Day, Easter, Thanksgiving Day, and Christmas Day. We are closed at noon Christmas Eve if it falls on Mon.-Thurs. and are closed all day if it falls on Fri.-Sun.
State Archives: 8 a.m. - 4:30 p.m. M-F, except state holidays; 2nd Sat. of each month, 10 a.m. - 4:30 p.m. Appointments are recommended. To schedule an appointment, please contact us at 701.328.2091 or archives@nd.gov.
State Historical Society offices: 8 a.m. - 5 p.m. M-F, except state holidays.
Contact Us:
phone: 701.328.2666
email: history@nd.gov
Social Media:
See all social media accounts